Read the results
The run is finished. This part reads it.
The summary
Open the run from Benchmarks. It opens on Summary.
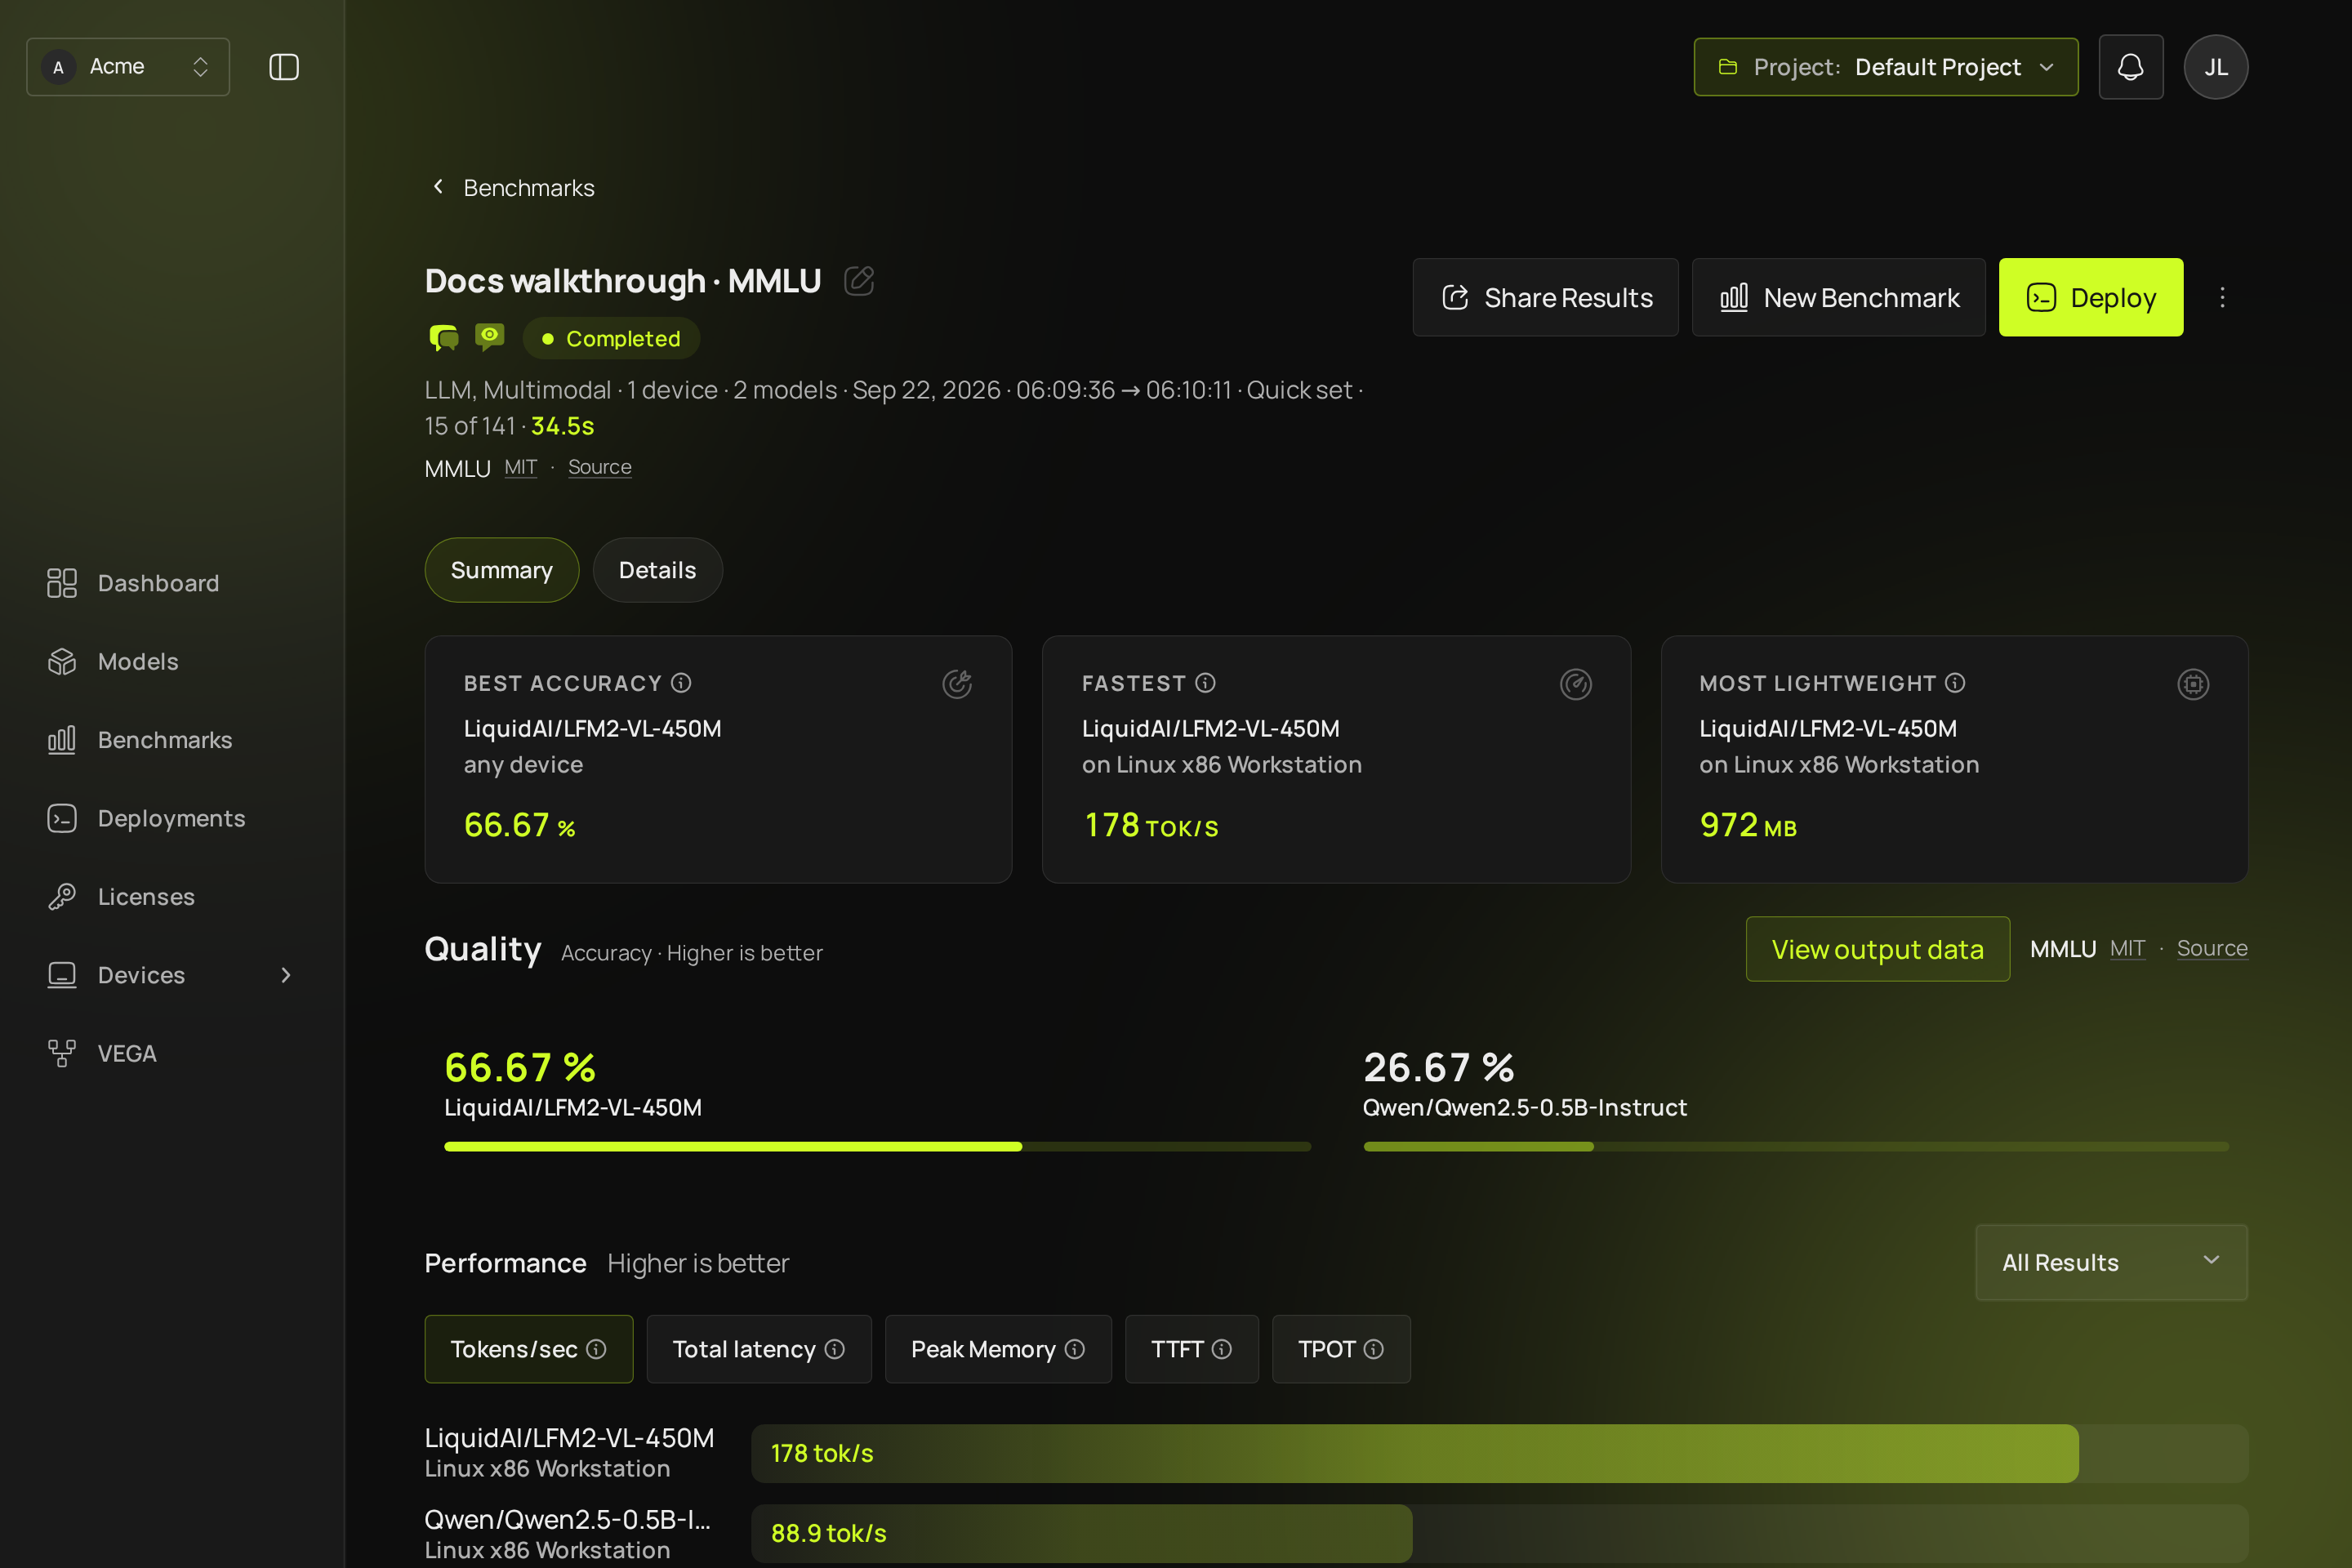
The screenshots on this page come from a finished run that compares two models on one device, so there is something to read in every section. A single-model run shows the same sections with one bar in each.
The header states what the run was: its status, the models, the devices, when it started and finished, how long it took, whether it ran the quick set or the full dataset, and the benchmark's license with a link to its source.
The headline cards answer the three questions people ask first. Best accuracy is the highest quality score in the run. Fastest is the highest throughput, with the device it was measured on. Most lightweight is the smallest peak memory, again with its device. Each names the model, so a two-model run tells you which one won each question at a glance.
Quality compares every model in the run on the selected quality metric, with the direction stated ("higher is better") so a number is never ambiguous.
Performance carries one tab per metric. A performance benchmark runs a concurrency sweep, three prompt shapes at one, four and eight parallel streams, and the sweep rows are the section's primary detail, so you see how the device holds up under load and not only its single-stream figure.
| Metric | What it measures | Direction |
|---|---|---|
| Tokens/sec | Decode throughput, the tokens the model produced per second. | Higher is better. |
| TTFT | Time to first token, the wait before output starts appearing. | Lower is better. |
| TPOT | Time per output token, the pace once output has started. | Lower is better. |
| Total latency | End to end time for the request. | Lower is better. |
| Peak Memory | The most memory the run held at once. | Lower is better. |
Where a metric was measured over many samples, the result also carries its minimum, median and maximum, so you can see whether an average hides a long tail.
An LLM Performance run also shows the sweep as a table of cells. A cell is written prompt tokens:output tokens (128:128 is a 128-token prompt answered with 128 tokens), and c1, c4 and c8 are the number of parallel streams. A run with only LLM Performance shows its own cards (TTFT, Tokens/sec, Peak decode, TPOT and Peak Memory), and its TTFT and Tokens/sec cards are the median over every cell of the sweep, with the minimum and maximum beside it. That median mixes one, four and eight streams, so to compare devices, compare the single-stream (c1) rows of the table. Peak decode is the busiest cell's total, which rises with streams while time to first token grows. A Performance run carries no quality score, because it does not check the answers; add an accuracy test to the run for that.
The evidence behind a score
A score on its own is a claim. View output data opens the per-sample record behind it, in a dialog over the result, with a model switcher when the run compared several.
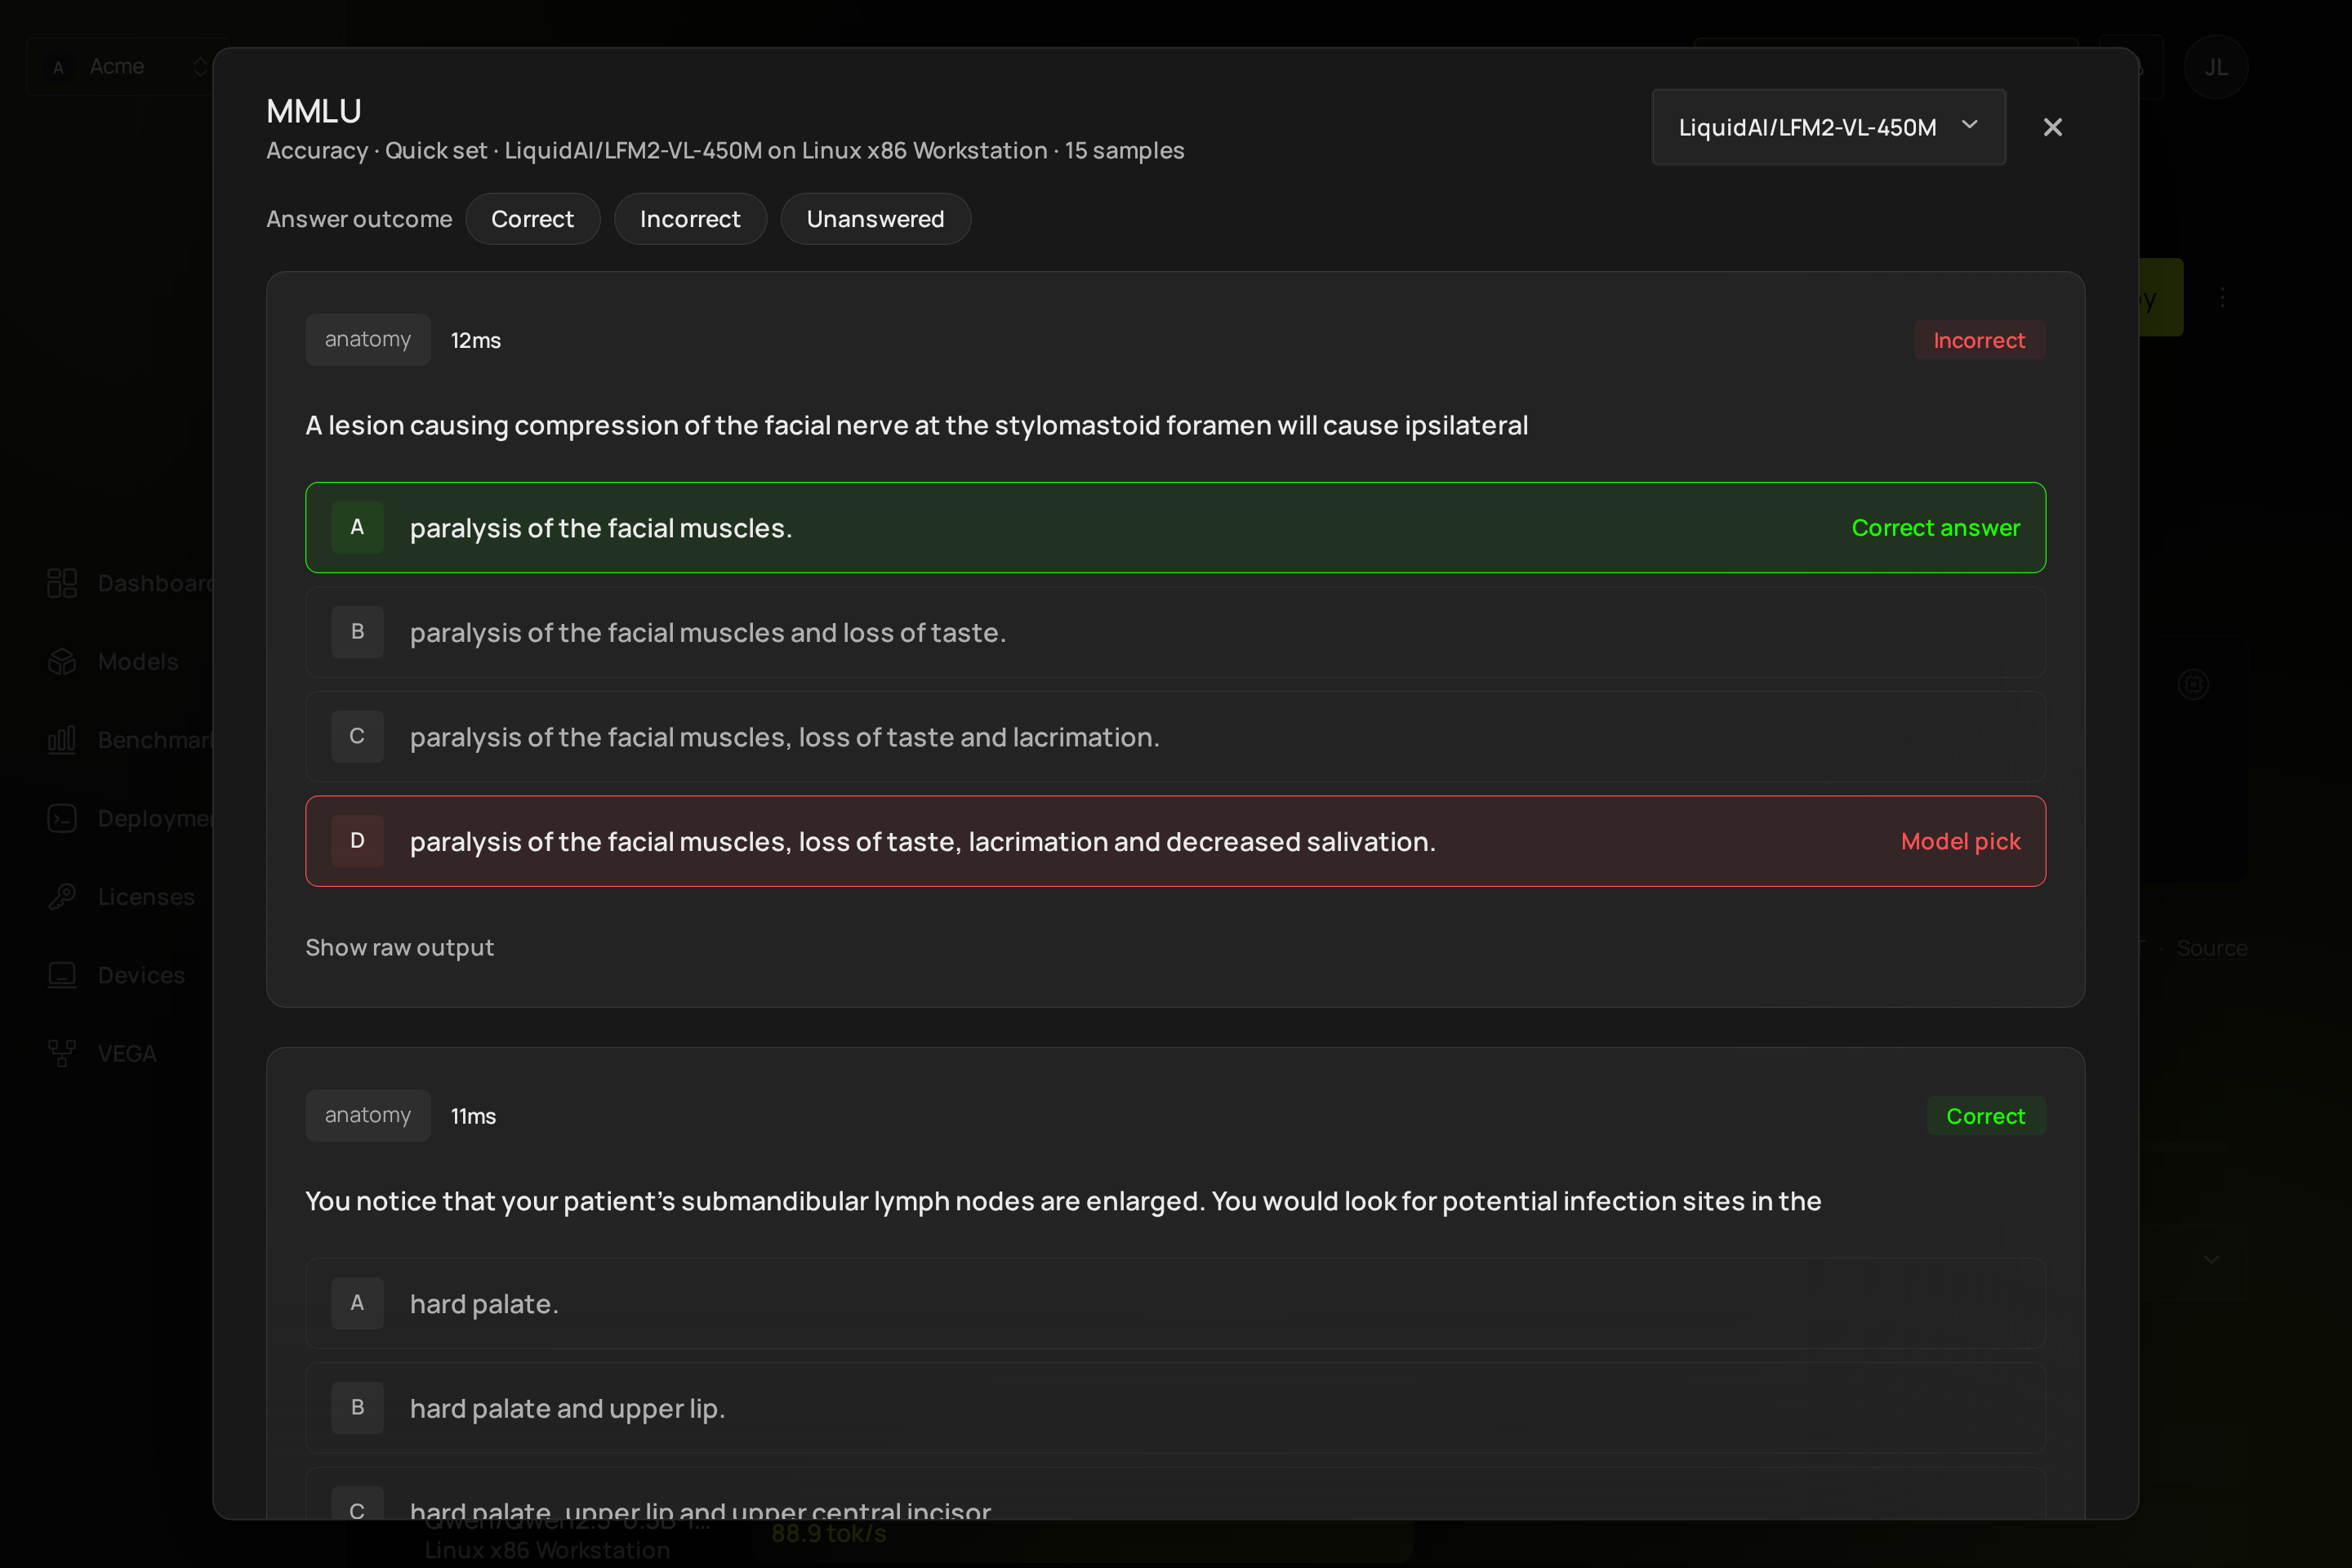
The card fits the task: a text answer beside its reference, the predicted and expected label for image classification, the generated image or audio for a generation task, the transcript for speech recognition.
Each card is one item the model was given: the input it saw, what it answered, what the expected answer was, and whether that counted as correct. The filters at the top narrow to correct, incorrect or unanswered items, which is the fastest way to understand a score that surprised you. A multiple-choice test shows the choices in the order the model saw them; a transcription test shows the audio reference, the predicted text and the word error rate; a coding test shows the program and its test outcome.
This is the difference between "the model scored 33 percent" and knowing which kind of question it missed.
Share it
Share Results turns the run into something you can hand to someone who has no account on your deployment.

The dialog previews the card the recipient sees: the run's name, its models and devices, and the three headline numbers. Under it are the ways to pass it on.
- Share publishes the run and gives it a link. From then on the state line reads that anyone with the link can view it, and the run is readable without signing in.
- Copy link puts that link on your clipboard, which is what you paste into a message or a ticket.
- Download Image saves the preview card as a picture, for a slide or a chat where a link would not render. It is a snapshot: it does not update when the run does, and it carries no link back to the platform.
- Make private revokes the link. Anyone holding it stops being able to open the run, immediately.
There is one live link per run, so re-sharing does not accumulate links behind your back, and revoking is a single action rather than a hunt.
Deploy it
Deploy on the result creates a deployment of the model the run measured, which Model deployment covers. It lands in the project shown in the project switcher, so check the switcher before pressing it when you work in more than one project. The benchmark has already put the engine on the device, so the deployment reads "Starting" for about two to three minutes before it is running; on a device that has never run the engine, the first start takes five to nine minutes.
Reading two runs against each other
Inside one run, the platform draws the comparison for you. The quality section puts every model side by side, and the performance section groups the same metric per model or per device, so a two-model run answers "which one, on this hardware" without any work from you.
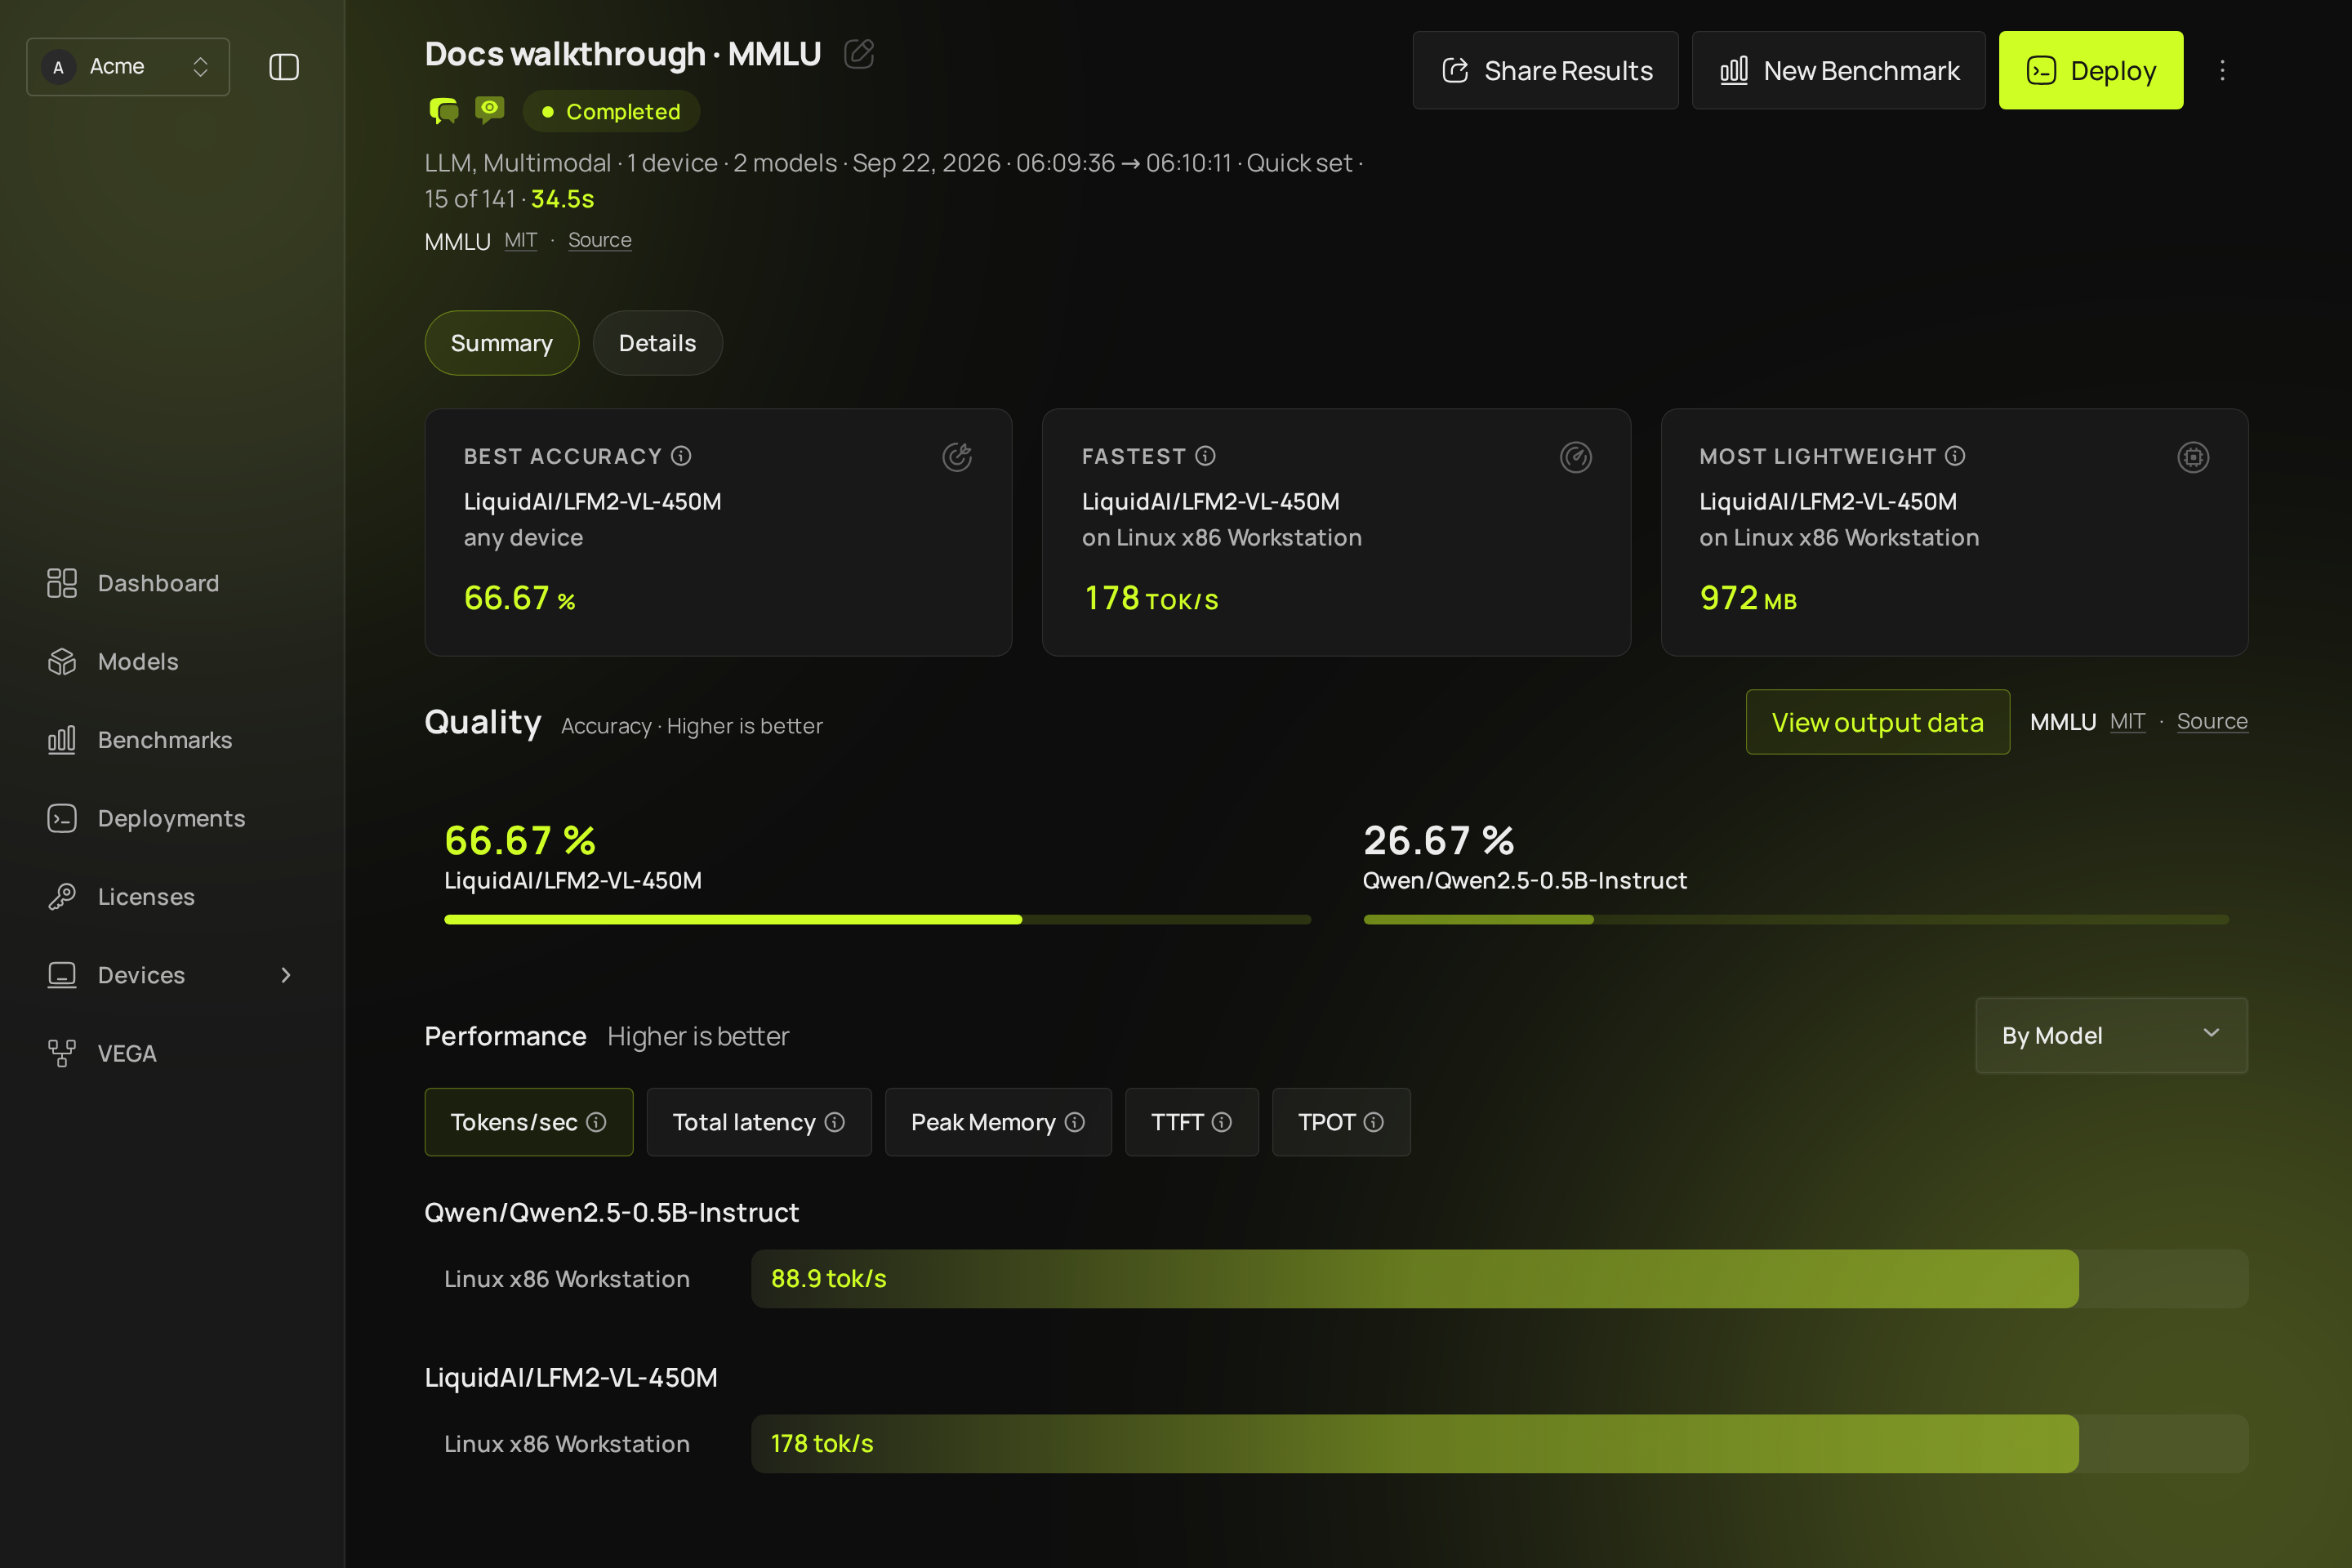
The grouping control switches between all results, by model and by device. By model reads naturally when you are choosing between models on one device; by device when you are choosing where to run one model.
Across two separate runs, you read the two pages against each other, and two habits make that reliable. Performance metrics compare cleanly across devices, which is the point of measuring on the real hardware. Quality scores are safest compared within one device, because a test's score depends on the engine and the settings that device ran; when two devices disagree on a quality score, the per-item view is what turns the disagreement into an explanation, since you can compare the actual answers rather than the totals.
What you have now
A measured model, on real hardware, with the evidence attached.
- Full detail: Benchmark and Read benchmark results.
- Next: What to read next.